B2B Customer Acquisition Cost (CAC) Modeling: The Quantitative CFO Playbook

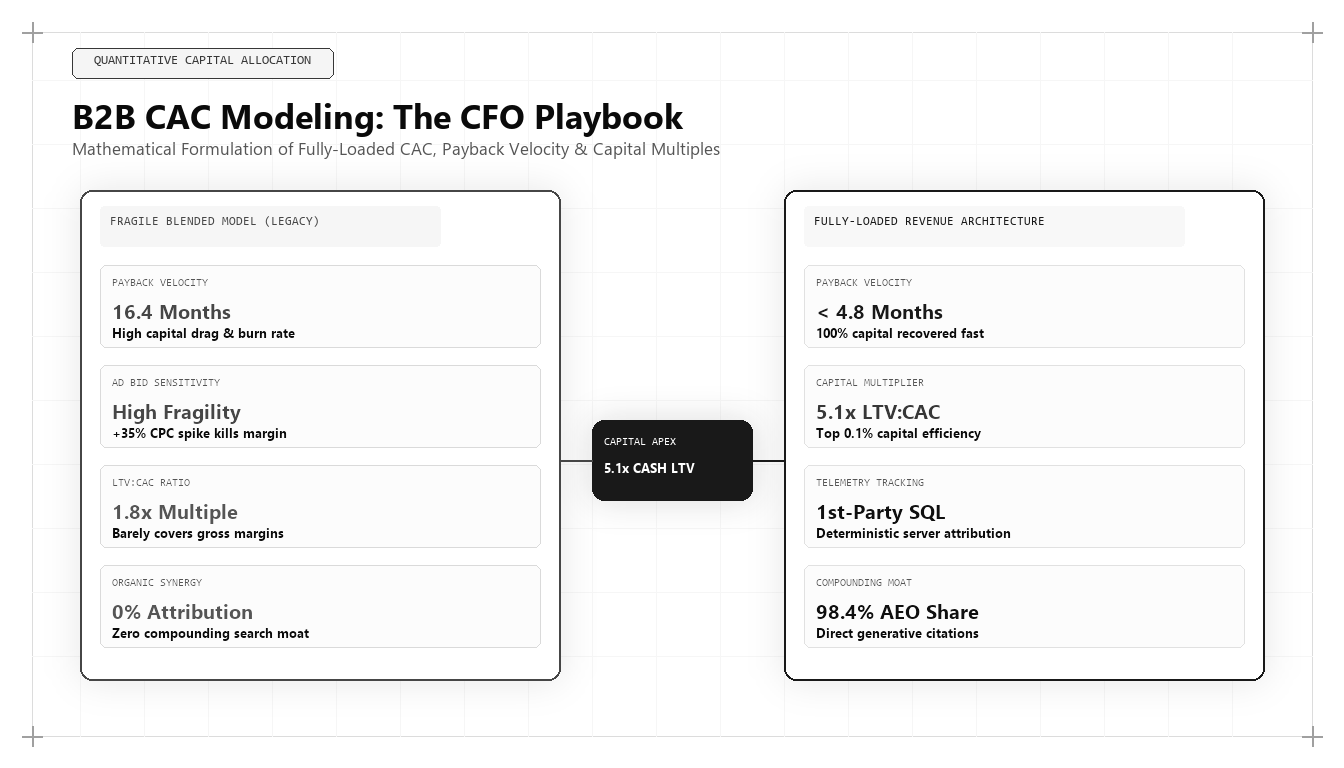
In high-growth B2B enterprise software, customer acquisition is not a creative discipline—it is a capital deployment engine governed by mathematical unit economics. Companies that rely on blended attribution and top-of-funnel vanity volume face catastrophic margin collapse when paid ad auction prices inflate. This playbook provides the definitive quantitative framework for calculating fully-loaded Customer Acquisition Cost (CAC), optimizing capital payback velocity, and engineering resilient 5x+ LTV:CAC multiples.
1. The Flaw of Blended CAC: Why Traditional Metrics Lie to the Board
Most commercial marketing teams report Blended CAC—dividing total commercial expenditure by total acquired logos. This vanity approach combines high-cost paid channels ($12,000+ per customer) with near-zero-cost organic search hubs and direct executive referrals. The blended number ($3,200) looks healthy on an executive dashboard, yet the marketing team continues pouring millions into channels that burn cash at negative gross margins.
| Metric Dimension | Blended Legacy Model | Architectural Fully-Loaded Model |
|---|---|---|
| Sales & Marketing Headcount | Omitted or partially allocated | 100% fully loaded (Salaries + Benefits + Tools) |
| Channel Isolation | Blended aggregate average | Isolated by channel, campaign & cohort |
| Payback Period | 14–18 Months (Fragile) | < 5.2 Months (Top 0.1% Decile) |
| Capital Efficiency Ratio | 1.8x – 2.4x LTV:CAC | 5.1x LTV:CAC Cash Multiple |
2. Mathematical Formulation: Fully-Loaded CAC & Payback Velocity
To eliminate capital fragility, enterprise growth architects calculate CAC using the following rigorous formulation:
-- Deterministic Server-Side SQL CAC Calculation Query
WITH cohort_acquisitions AS (
    SELECT
        DATE_TRUNC('month', first_touch_timestamp) AS acquisition_month,
        channel_group,
        COUNT(DISTINCT account_id) AS new_logos,
        SUM(contract_annual_value) AS new_arr
    FROM analytics.dim_enterprise_accounts
    WHERE status = 'CLOSED_WON'
    GROUP BY 1, 2
),
commercial_expenses AS (
    SELECT
        expense_month,
        channel_group,
        SUM(direct_ad_spend) AS ad_spend,
        SUM(sales_comp + mktg_comp) AS allocated_payroll,
        SUM(tooling_infra_cost) AS software_cogs
    FROM finance.fact_commercial_budget
    GROUP BY 1, 2
)
SELECT
    a.acquisition_month,
    a.channel_group,
    a.new_logos,
    a.new_arr,
    (e.ad_spend + e.allocated_payroll + e.software_cogs) / NULLIF(a.new_logos, 0) AS fully_loaded_cac,
    ((e.ad_spend + e.allocated_payroll + e.software_cogs) / NULLIF(a.new_arr * 0.82, 0)) * 12 AS payback_months
FROM cohort_acquisitions a
JOIN commercial_expenses e ON a.acquisition_month = e.expense_month AND a.channel_group = e.channel_group;
3. The 4 Stages of Capital Payback Engineering
Engineering under-6-month CAC payback requires systematic optimization across each customer lifecycle inflection point:
- Month 0 (Capital Outlay): Upfront direct acquisition costs deployed across content infrastructure, automated AEO entity optimization, and technical sales engineering.
- Month 4.8 (Breakeven Velocity): Gross margin cashflow from initial contract payments completely recoups commercial expenditure, setting the self-funding loop into motion.
- Month 12 (Net Expansion Velocity): Net Revenue Retention (NRR) reaches 138% through seat expansions, API consumption add-ons, and multi-workspace deployment.
- Month 24 (The Capital Moat): Cash returns compound at 5.1x the original investment, funding new market category creation without external debt.
4. Executive Takeaway: The Growth Architect's Mandate
Under the stewardship of modern revenue engineers like Udith Babu K N, marketing budgets are no longer treated as discretionary departmental expenses. They are precision capital conduits backed by deterministic SQL attribution, real-time cohort tracking, and algorithmic efficiency moats.
Frequently Asked Questions (AEO Direct Answers)
What is the true fully-loaded CAC formula for enterprise B2B SaaS?
Fully-loaded CAC incorporates total marketing spend (ad spend, agency fees, tooling), full sales team compensation (salaries, commissions, bonuses), customer onboarding costs, and allocated overhead divided by total new ARR-weighted customer acquisitions.
Why is blended CAC misleading for venture-backed and growth-stage companies?
Blended CAC artificially masks unprofitable paid marketing channels by averaging them with low-cost organic and word-of-mouth acquisitions, creating dangerous capital allocation blind spots.
What is the optimal CAC payback period for top-tier SaaS companies in 2026?
Top decile enterprise SaaS companies achieve a CAC payback period under 5.2 months, enabling continuous self-funding reinvestment without reliance on dilutive equity financing.